
Data processing
Nova Insights provides data processing services to support other market research firms. With our strong background in research, we are able to be consultative in the services we offer.
Our data processing services include:
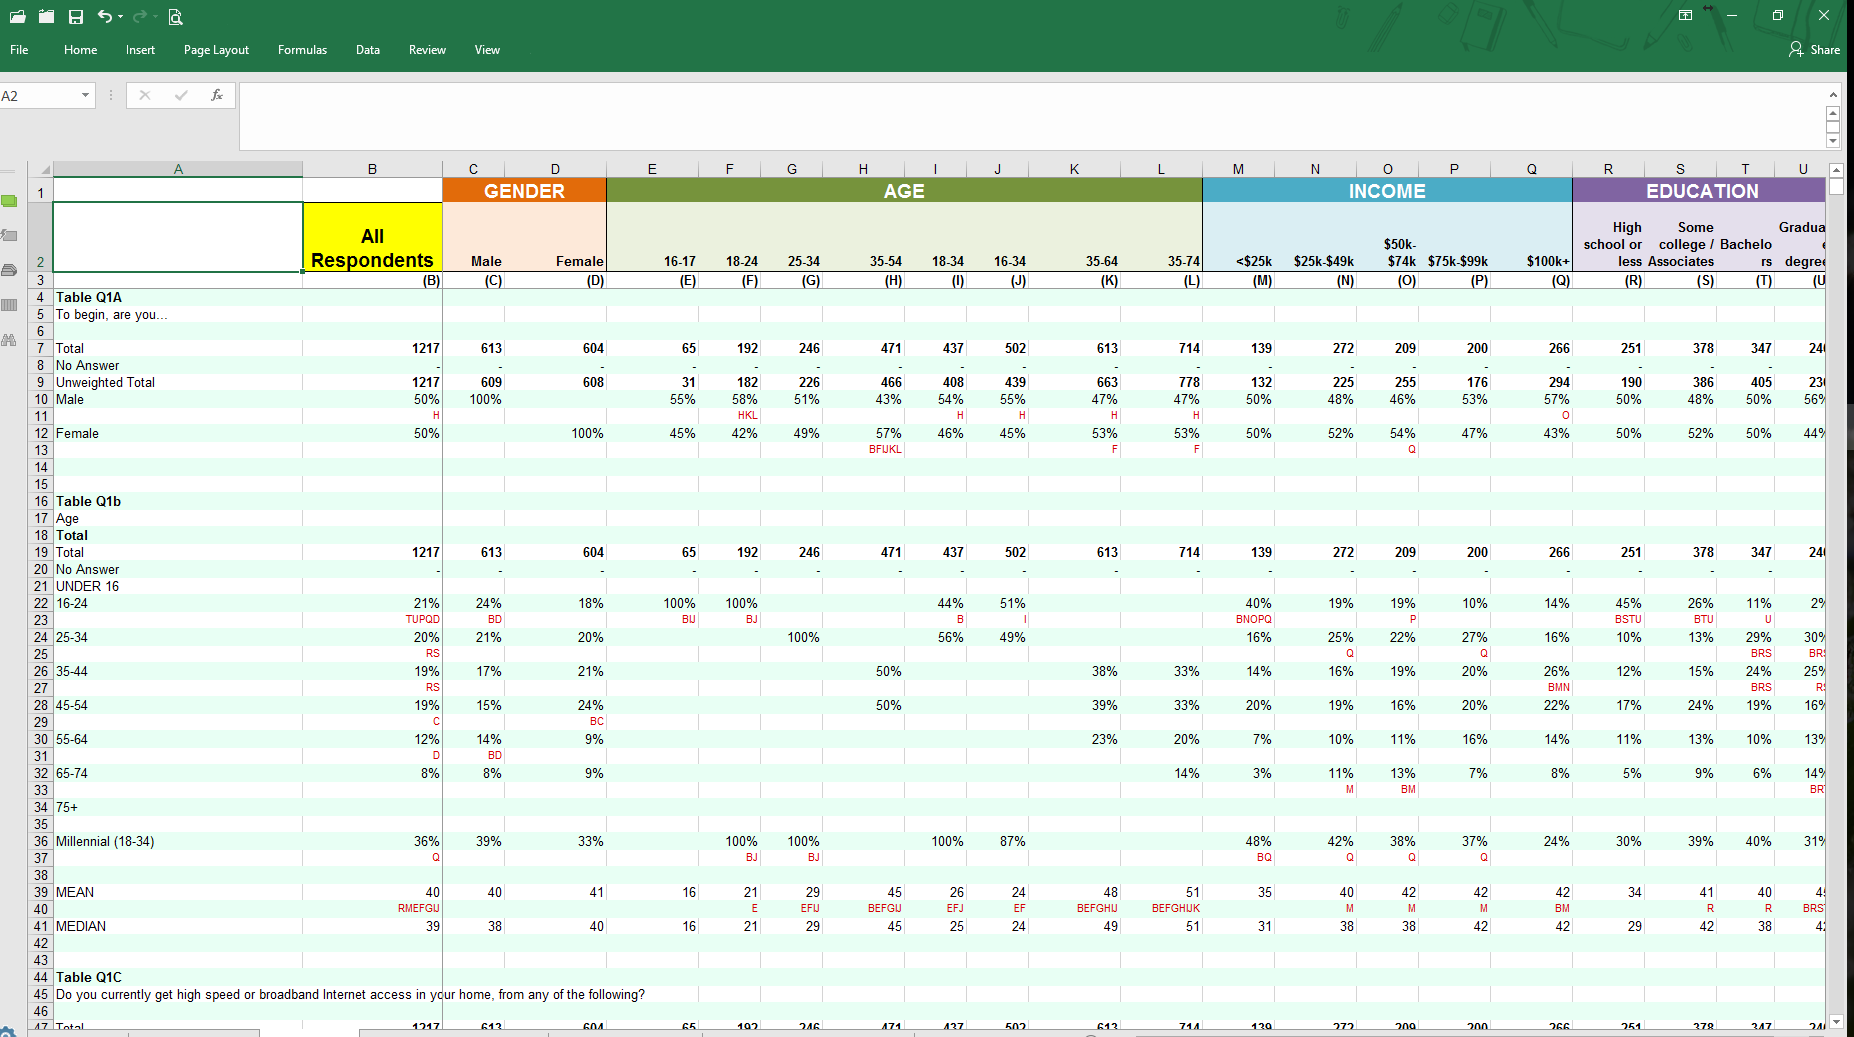
Sample Excel Output
- Cross tabulations (bivariate) in an easy-to-read MS Word® or Excel® format showing statistically significant differences at two confidence levels of your choice (e.g., 90%, 95%). Versions can also be created in Excel that make creation of charts and graphs very easy.
- Weighting of the data to better reflect known distribution proportions within the population being sampled.
- Creation of relevant indices helpful for a greater depth of understanding in trending groups of variables.
- Correlation analysis: A statistical technique that measures the degree of relationship between variables. Correlation coefficients can range from -1.00 to +1.00. The value of -1.00 represents a perfect negative correlation while a value of +1.00 represents a perfect positive correlation. If a correlation is 0, this means there is no relationship.
- Factor analysis: A technique used to determine the underlying themes of a set of variables. It reduces a larger number of variables to a smaller number of factors that can be used to explain the principle themes of the data.

- Cluster analysis: As factor analysis creates themes among a set of variables, cluster analysis creates a set of thematic segments among respondents representing the population under analysis.
- MaxDiff: A choice exercise for obtaining preference/importance scores for multiple items. It is also known as "best-worst scaling" and is most commonly used for message testing, brand preference, customer satisfaction, and product features.